Black-box Optimisation: Searching in the Dark
Subscribe to my newsletter to hear about my latest posts. No spam, I promise.
The previous articles on optimisation showed that we could leverage information about optimisation problems to solve them quicker. But what if we have no or very little information about a problem? This post will walk through various black-box optimisation methods, aiming to find a needle in a computational haystack.
Uninformed Search with Random and Grid Search
If we have no idea about the shape of the objective function, the only thing we can do is to try combinations and record the objective function value we get. Imagine trying to crack open a safe or trying to start a washing machine with commands written in a (fully) foreign language.
In the field of optimisation, this is referred to as Black-Box Optimisation. You can imagine a black box with dials, giving you an output for each combination of dial positions.

# Representation of a black box function
def black_box(inputs):
    # The internal workings are unknown
    output = mysterious_function(inputs)
    return output
What would you do for such a problem?
The first approach would be to try a large enough number of random combinations until you reach a reasonable solution. The random approach is much better than it sounds. It can be a tough benchmark to beat.
If the search space is small enough, trying a grid of combinations could also be a reasonable approach. The idea there is to create a grid of possible combinations. This article will keep using the example of a company choosing the quantity of chairs and tables to produce to optimise profits described in the previous two articles.
The following table shows how such a grid could look for our example of tables and chairs:
| Tables ( |
Chairs ( |
|---|---|
| 0 | 0 |
| 0 | 10 |
| 0 | 20 |
| ⋮ | ⋮ |
| 10 | 0 |
| 10 | 10 |
| 10 | 20 |
| ⋮ | ⋮ |
| 100 | 90 |
| 100 | 100 |
These two methods belong to the family of uninformed search methods. They do not assume anything about the objective function. They also do not adapt their search strategy to the results collected (more on this later).
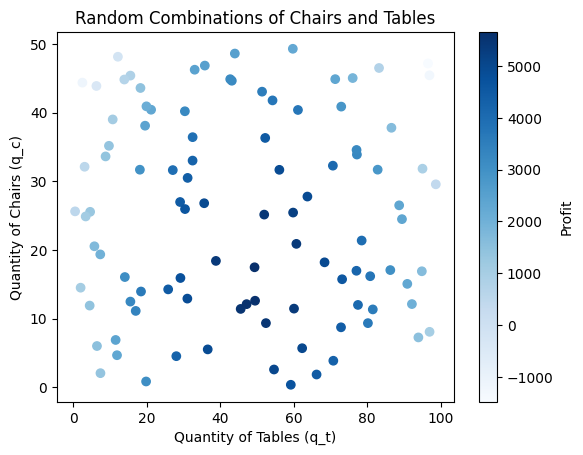
Not assuming anything about the objective function is a strong stance. The following chart plots 100 random combinations of chairs and tables coloured by the profit they generate.

Python code used to generate the chart
import numpy as np
import matplotlib.pyplot as plt

# Generate 100 random combinations
q_t = np.random.uniform(0, 100, 100)  # Tables quantity between 0 and 50
q_c = np.random.uniform(0, 50, 100)  # Chairs quantity between 0 and 50

# Objective function values (assuming some function, e.g., profit)
def profit(q_t, q_c):
    p_t = 400  # Price per table
    p_c = 250  # Price per chair
    R = p_t * q_t + p_c * q_c
    C1 = 2 * q_t**2 + 200 * q_t + 100
    C2 = 3 * q_c**2 + 150 * q_c + 80
    C = C1 + C2
    return R - C

profits = profit(q_t, q_c)

# Scatter plot
plt.scatter(q_t, q_c, c=profits, cmap='Blues')
plt.colorbar(label='Profit')
plt.xlabel('Quantity of Tables (q_t)')
plt.ylabel('Quantity of Chairs (q_c)')
plt.title('Random Combinations of Chairs and Tables')
plt.show()
Does something strike you? It seems that good objective function values cluster together; the same applies to worse objective function values. This is the case for many black-box optimisation problems—good solutions tend to cluster together.
Could this be leveraged by a search algorithm? Based on this observation, would it make sense to focus the search in promising areas of the search space?
This is where heuristic optimisation comes in.
The main reason why the grid and random search algorithms are uninformed search methods is that the sampling of new solutions is not modified by the results of the search. These methods will not focus on any area of the search space in particular, regardless of the results obtained there.
The assumption that good solutions are located close to each other in the search space can be referred to as locality. This concept of locality is something that can be exploited by search algorithms. How would you go about it?
A simple adaptation to grid and random search would be to stop when hitting the maximum/minimum observed up to now, and explore similar combinations in greater detail. As an example, if random search stumbles on very high profits with a combination of 29 chairs and 51 tables, it would make sense to try out
Another approach could be very similar to gradient descent. We could start with a random solution and evaluate all the combinations in its neighbourhood. The neighbourhood of a solution is the set of all combinations located close to a given combination. By “close to” we mean where only a small change is required to go from our source combination to the neighbour combination. As an example, the combination [20 chairs, 31 tables] is a neighbour of the combination [20 chairs, 30 tables].
The following diagram shows what a neighbourhood (noted

The definition of the distance between two combinations depends on the problem definition. When combinations are defined by a vector of real numbers of the same scale (e.g., chairs and tables), then the Euclidean distance could be a good metric.
The name “Euclidean distance” can sound threatening. It can be seen as the application of the Pythagorean Theorem, as shown in the example diagram below. To find the distance between two points is equivalent to finding the length of the hypothenus of the right triange with sides:

Extending this to an arbitrary number of dimensions (
Applied to the above two combinations:
Let
Back to optimisation, we could start with a random solution and evaluate combinations in its neighbourhood. If we find a neighbour with a better objective function value, we continue by evaluating all combinations in its neighbourhood and continue until a local optimum is reached; i.e., when no neighbour has a better objective function value.
This method is called Hill Climbing as it always follows the direction of steepest increase/decrease. Like gradient descent, such an optimisation method can be stuck in local optima. This is why a common improvement to this method is to add several random restarts at different points of the search space.
Letting Natural Selection Do the Work
Another fascinating approach to black-box optimisation is genetic algorithms. Genetic algorithms are inspired by the process of natural selection at work on our planet. The idea is to represent problem solutions as “genes”; in practice, just vectors of numbers such as
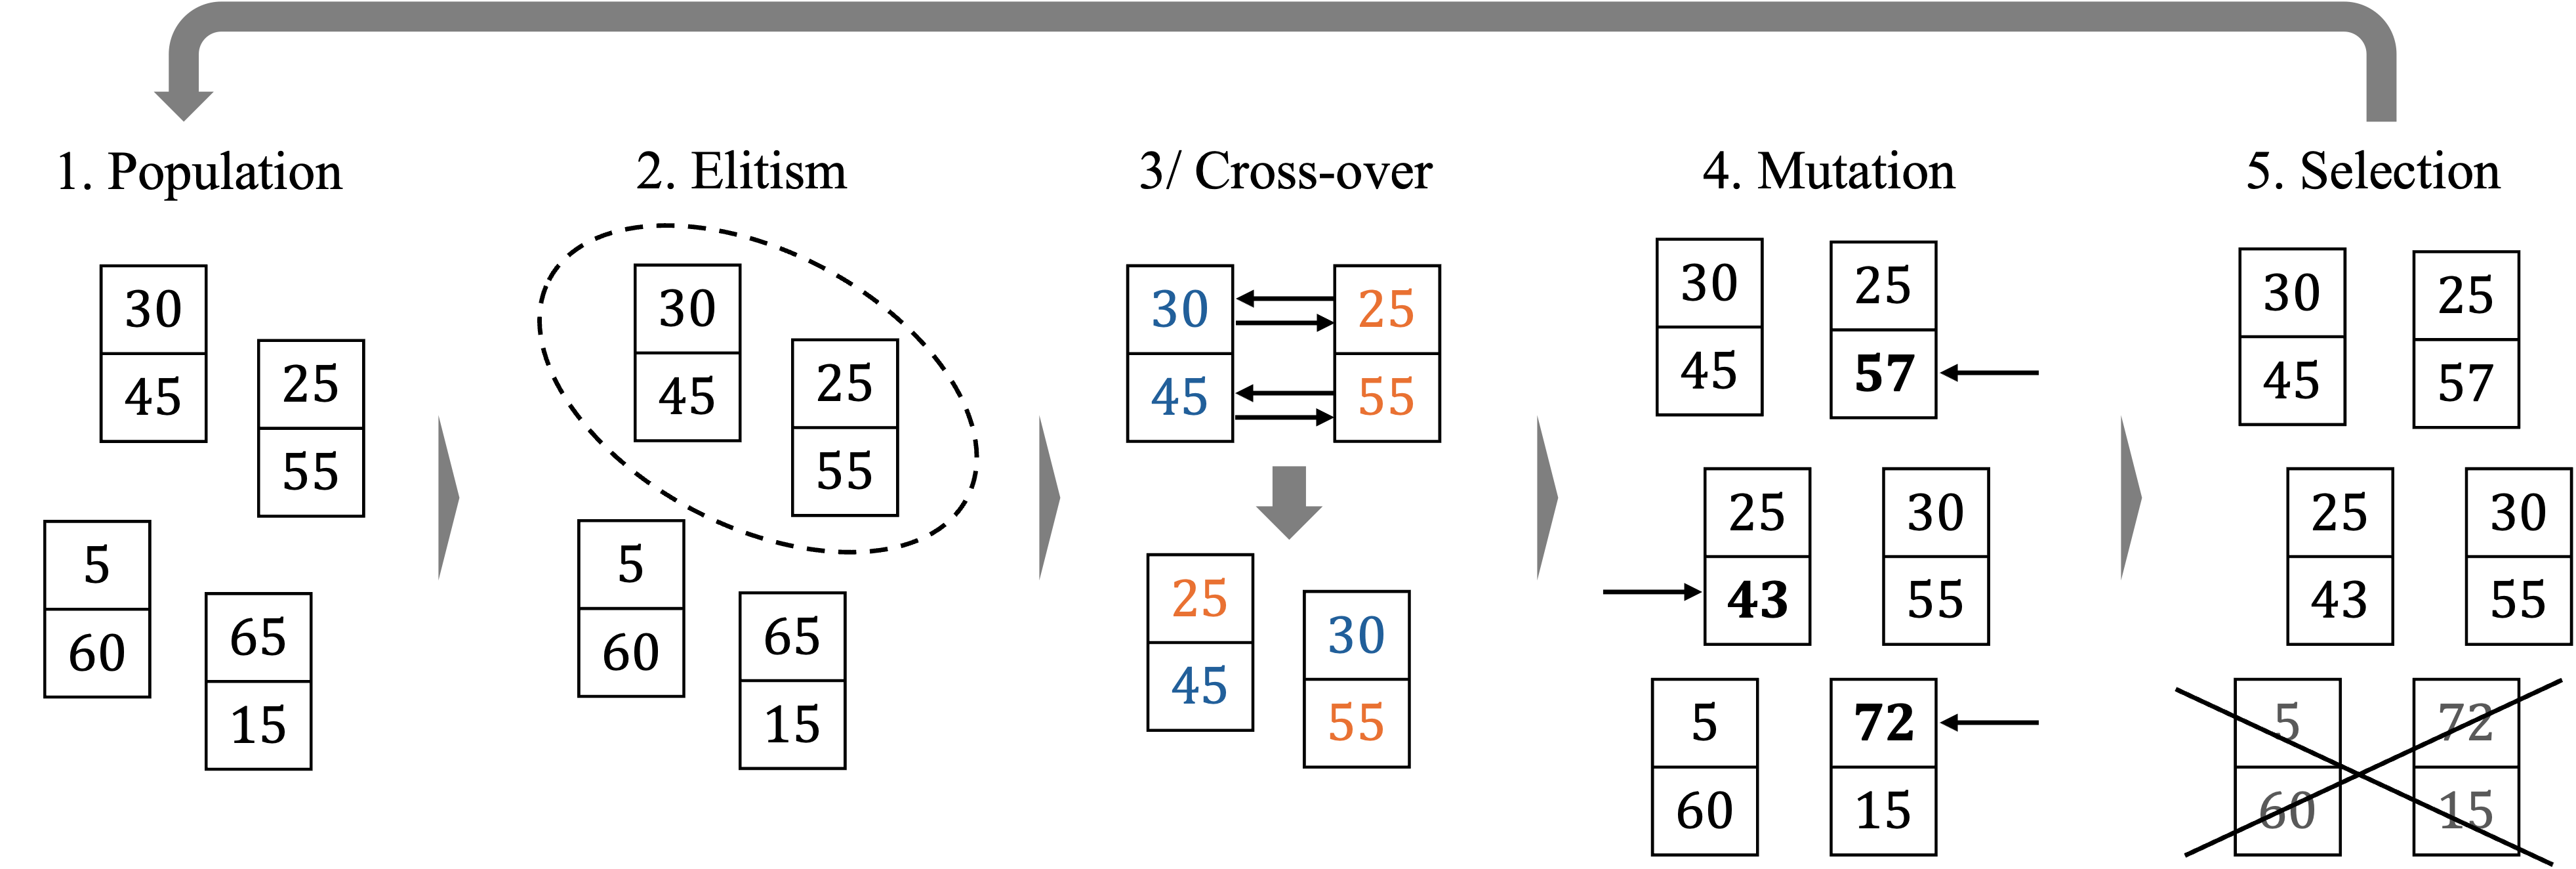
The general workings of a genetic algorithm are shown in the image explained below.

The algorithm is initiated by randomly sampling a set of solutions, the starting “population” (1). It then selects the best genes in terms of objective function evaluation (2) and applies a “crossover” operation to create “children” (3). Following this process, parts of all genes are randomly “mutated” (4), introducing randomness to escape local optima. The less fit genes of the population are discarded (5). The process is then repeated for a given number of iterations or until the algorithm reaches convergence; i.e., when the best solution does not change for a given number of iterations.
Implementation of a simple genetic algorithm in Python
# Genetic Algorithm Optimisation Process

import numpy as np

# Define the objective function
def objective_function(individual):
    q_t, q_c = individual
    p_t = 400  # Price per table
    p_c = 250  # Price per chair
    # Revenue
    R = p_t * q_t + p_c * q_c
    # Costs
    C1 = 2 * q_t**2 + 200 * q_t + 100
    C2 = 3 * q_c**2 + 150 * q_c + 80
    C = C1 + C2
    # Profit
    return R - C

# Initialise the population
population_size = 20
population = [np.random.uniform(0, 50, 2) for _ in range(population_size)]  # Random solutions

# Genetic Algorithm parameters
num_generations = 50
mutation_rate = 0.1

for generation in range(num_generations):
    # Evaluate fitness
    fitness = [objective_function(individual) for individual in population]

    # Select the best individuals (e.g., top 50%)
    num_selected = population_size // 2
    selected_indices = np.argsort(fitness)[-num_selected:]
    selected_population = [population[i] for i in selected_indices]

    # Generate new population via crossover
    new_population = []
    while len(new_population) < population_size:
        parents = np.random.choice(len(selected_population), 2, replace=False)
        parent1 = selected_population[parents[0]]
        parent2 = selected_population[parents[1]]
        # Crossover (e.g., average)
        child = (parent1 + parent2) / 2
        # Mutation
        if np.random.rand() < mutation_rate:
            mutation = np.random.normal(0, 1, size=2)
            child += mutation
        # Ensure child values are within bounds
        child = np.clip(child, 0, 50)
        new_population.append(child)

    population = new_population
    # Optionally, check for convergence

# Extract the best solution
best_individual = max(population, key=objective_function)
best_profit = objective_function(best_individual)
print("Best solution:", best_individual)
print("Best profit:", best_profit)
As a short biographical note, it is a genetic algorithm that drew me into the field of Computer Science and optimisation. Back in early 2020, I was a Data Science consultant in London. I had to optimise the schedule of a camping park’s maintenance staff. The objective was to minimise the number of cleaners working at the same time while making sure that all bungalows would be cleaned once between check-out and the check-in of new guests (constraint).
I had no idea how to do this, and there was no ChatGPT to help. I found a few papers on similar problems and found out about genetic algorithms. As I was still a novice programmer, I made the all too common mistake of not looking for existing implementations and implemented it all by myself.
Seeing this process imitating natural selection and solving a real-world problem blew my mind. After a few seconds, I was relieved to see that the algorithm had not returned 42 but a workable solution.
I then went on to study Computer Science. A few years later, I am grateful for having the opportunity to write about and teach these topics to the next generation of hackers and engineers.
Modelling the Shape of the Objective Function
In the case of black-box optimisation, we do not know anything about the shape of the objective function. The only information we have are the evaluations of the combinations we sample.
Based on these samples, we can use Machine Learning to create a model of the objective function that will improve as the number of samples we collect grows. Models like Gaussian Processes allow us to predict both the expected value of a function the uncertainty associated with the prediction.
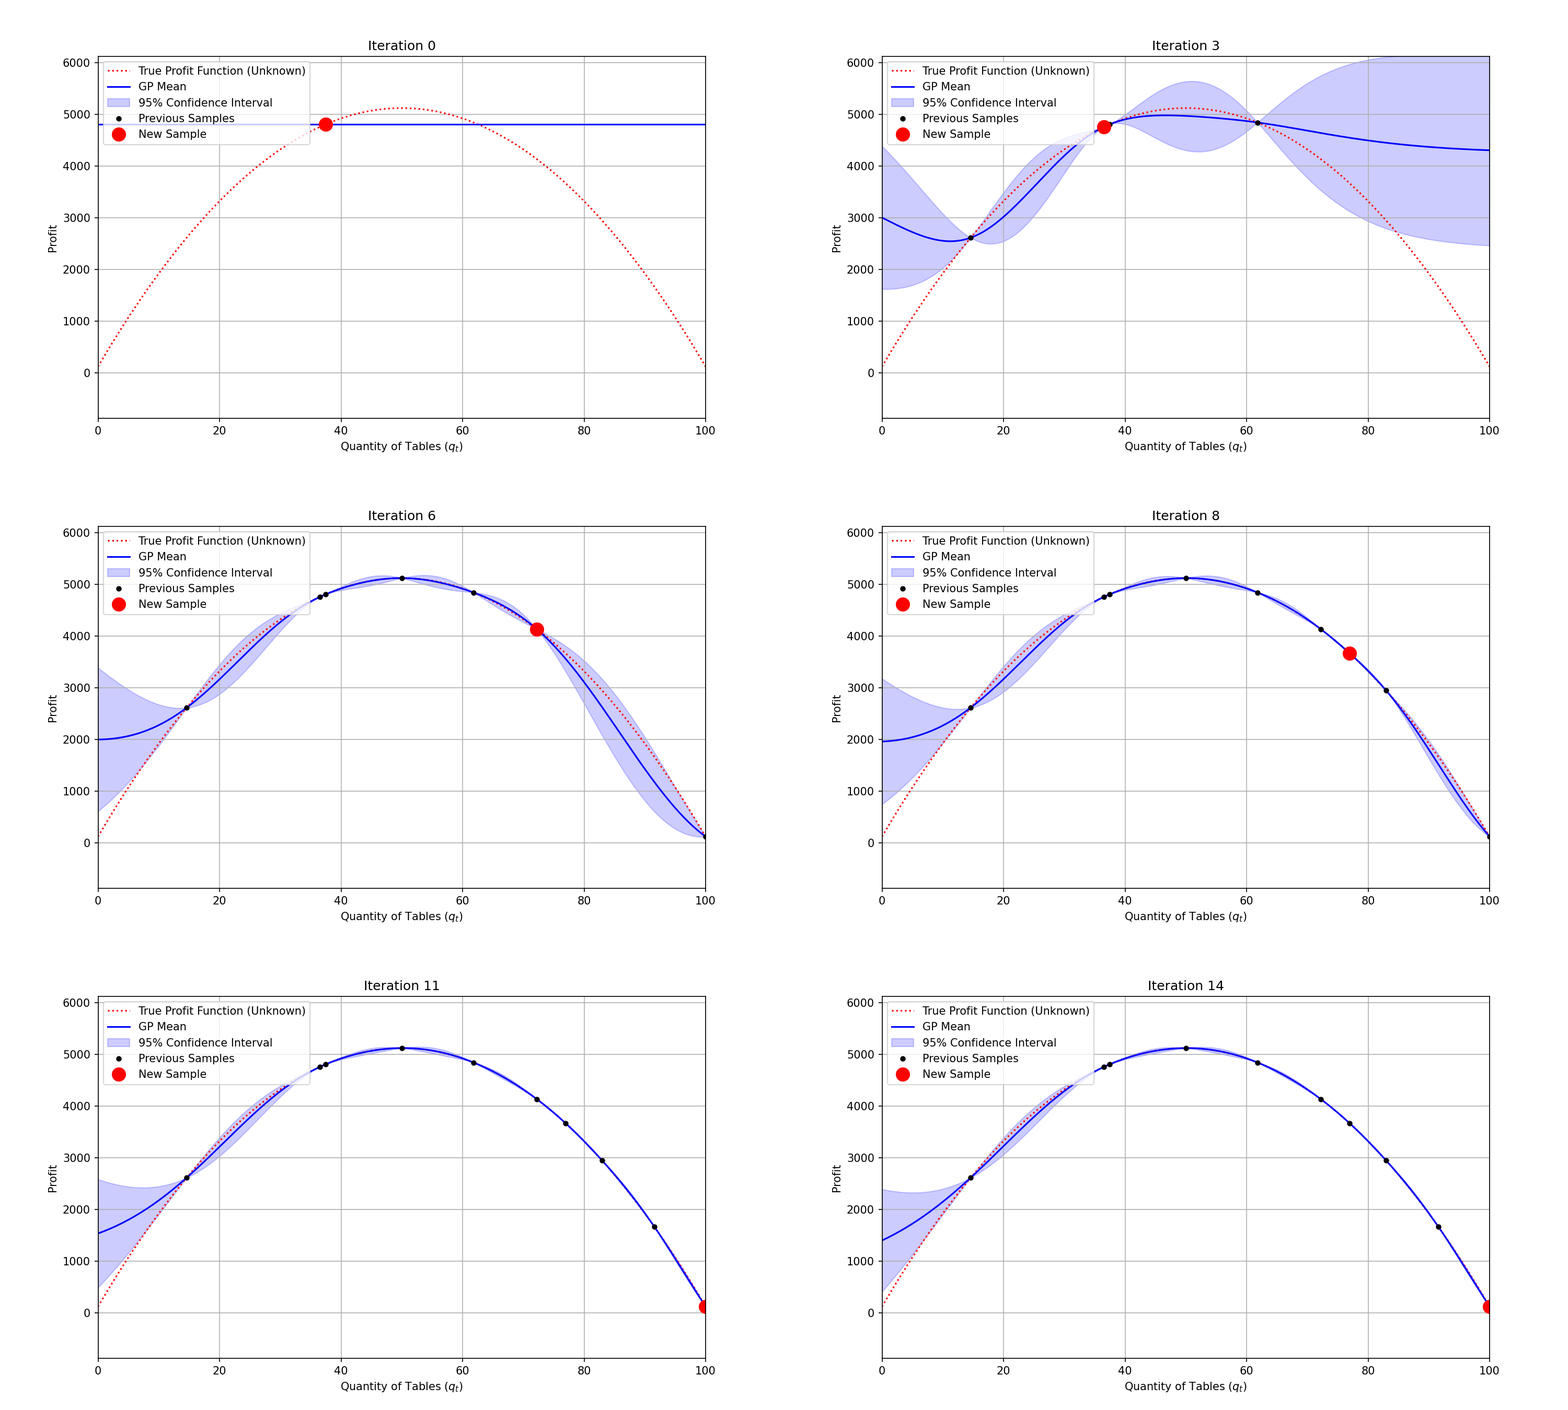
At each iteration, we could fit a Gaussian Process to the samples we have already collected, and sample the next combination based on the Expected Improvement predicted—a combination of expected function value improvement and uncertainty reduction.
You can see on the animation below that uncertainty (represented by the shaded area) shrinks around the points that were evaluated. It takes only a few evaluations for the modelled function (“GP mean”) to closely match the true and unknown objective function. The maximum profit is found at iteration 4.

Code used to generate the animation
import numpy as np
import matplotlib.pyplot as plt
from matplotlib import animation
from sklearn.gaussian_process import GaussianProcessRegressor
from sklearn.gaussian_process.kernels import Matern

# Define the objective function (profit) as a function of one variable q_t
def profit(q_t):
    q_c = 30  # Fixed chairs quantity for univariate example
    p_t = 400
    p_c = 250
    # Revenue
    R = p_t * q_t + p_c * q_c
    # Costs
    C1 = 2 * q_t**2 + 200 * q_t + 100
    C2 = 3 * q_c**2 + 150 * q_c + 80
    C = C1 + C2
    # Profit
    return R - C

# Bounds for q_t
q_t_min = 0
q_t_max = 100

# True function values (for plotting)
q_t_true = np.linspace(q_t_min, q_t_max, 100)
profit_true = profit(q_t_true)

# Initial samples
np.random.seed(42)
q_t_samples = np.random.uniform(q_t_min, q_t_max, 1)
profit_samples = profit(q_t_samples)

# Kernel for Gaussian Process
kernel = Matern(nu=2.5)

# Number of iterations
num_iterations = 15

from scipy.optimize import minimize_scalar
from scipy.stats import norm

# Prepare data for animation
q_t_samples_all = [q_t_samples.copy()]
profit_samples_all = [profit_samples.copy()]
gp_models = []

for i in range(1, num_iterations + 1):

    # Fit Gaussian Process
    gp = GaussianProcessRegressor(kernel=kernel, alpha=1e-6, random_state=42, normalize_y=True)
    gp.fit(q_t_samples.reshape(-1, 1), profit_samples)
    gp_models.append(gp)

    # Next sample (Bayesian Optimization step)
    def acquisition(q_t_new):
        q_t_new = np.atleast_2d(q_t_new)
        mu, sigma = gp.predict(q_t_new, return_std=True)
        sigma = np.clip(sigma, 1e-6, None)  # Avoid division by zero
        # Expected Improvement
        improvement = mu - np.max(profit_samples)
        z = improvement / sigma
        ei = improvement * norm.cdf(z) + sigma * norm.pdf(z)
        return -ei  # Negative for minimization (since we want to maximize)

    res = minimize_scalar(acquisition, bounds=(q_t_min, q_t_max), method='bounded')
    q_t_next = res.x
    profit_next = profit(q_t_next)

    # Update samples
    q_t_samples = np.append(q_t_samples, q_t_next)
    profit_samples = np.append(profit_samples, profit_next)
    q_t_samples_all.append(q_t_samples.copy())
    profit_samples_all.append(profit_samples.copy())

# Create the animation
fig, ax = plt.subplots(figsize=(10, 6))

def animate(i):
    ax.clear()
    gp = gp_models[i]
    q_t_pred = np.linspace(q_t_min, q_t_max, 200)
    profit_pred, sigma = gp.predict(q_t_pred.reshape(-1, 1), return_std=True)

    # Plot true function
    ax.plot(q_t_true, profit_true, 'r:', label='True Profit Function (Unknown)')
    # Plot GP mean
    ax.plot(q_t_pred, profit_pred, 'b-', label='GP Mean')
    # Plot confidence interval
    ax.fill_between(q_t_pred,
                    profit_pred - 1.96 * sigma,
                    profit_pred + 1.96 * sigma,
                    alpha=0.2, color='blue', label='95% Confidence Interval')
    # Plot previous samples
    if i > 0:
        ax.plot(q_t_samples_all[i-1], profit_samples_all[i-1], 'k.', markersize=8, label='Previous Samples')
    else:
        ax.plot(q_t_samples_all[i], profit_samples_all[i], 'k.', markersize=8, label='Previous Samples')
    # Highlight the new sample
    ax.plot(q_t_samples_all[i][-1], profit_samples_all[i][-1], 'ro', markersize=12, label='New Sample')
    ax.set_xlabel('Quantity of Tables ($q_t$)')
    ax.set_ylabel('Profit')
    ax.set_title(f'Iteration {i}')
    ax.legend(loc='upper left')
    ax.set_xlim(q_t_min, q_t_max)
    ax.set_ylim(min(profit_true)-1000, max(profit_true)+1000)
    ax.grid(True)

# Create animation
anim = animation.FuncAnimation(fig, animate, frames=num_iterations, interval=2000)
The mathematical details of Bayesian Optimisation are beyond the scope of this article. If you are interested in these topics, get in touch! I am always happy to discuss.
Making Sense of Optimisation Methods
The information we collect about a problem allows us to save significant amounts of computation. The more information we have—such as the objective function or access to gradient observations—the fewer samples we need to find an optimal solution.
Even with black-box methods, we can assume locality (good solutions would cluster together in the search space) or build models of the objective function based on the evaluations we sample.
For the problem you are trying to solve, can you do better than uninformed search? What additional information can you bring?
Even with additional information, black-box optimisation gets more challenging as the cost of evaluating a single solution increases. Would you imagine running a random search or genetic algorithm when a single solution evaluation takes several hours? If that sounds like an exciting challenge, head to the next article in the series on multi-fidelity optimisation. As a bonus, I included some tips on how to choose books or TV shows.