What is Algorithm Complexity?
Subscribe to my newsletter to hear about my latest posts. No spam, I promise.
The third lecture of the semester had just started. I was still a young lecturer full of hope and naive optimism. After 10 minutes of going through the maths of asymptotic notation, I still remember looking back to the classroom and seeing 30 puzzled pairs of eyes staring into the existential vacuum. This was the first time I was trying to teach a concept that has scared generations of Computer Science students. My dear IT3 group, if you are reading this, sorry again, this article is for you.
The notion of algorithmic complexity relates to the resources used by running an algorithm. The most studied complexities are time and space complexity. They are traditionally expressed using asymptotic notation.
As an abstract thinker, equations and letters were the easiest way for me to approach this concept. This perspective was not shared by my students. This article will provide a simple explanation, focussing on time complexity. It is the first part in a three-part series. The following articles cover asymptotic notation and Python code snippets analysis.
Algorithm analysis is concerned with the time (or space) required to run an algorithm as its input becomes infinitely large. Before going into any kind of maths or code, this post will explain complexity through a toy example.
Let’s imagine you are organising a party. As a serious Computer Scientist you are analysing the complexity of various tasks you will have to do, as the number of guests
Greetings: Linear Complexity
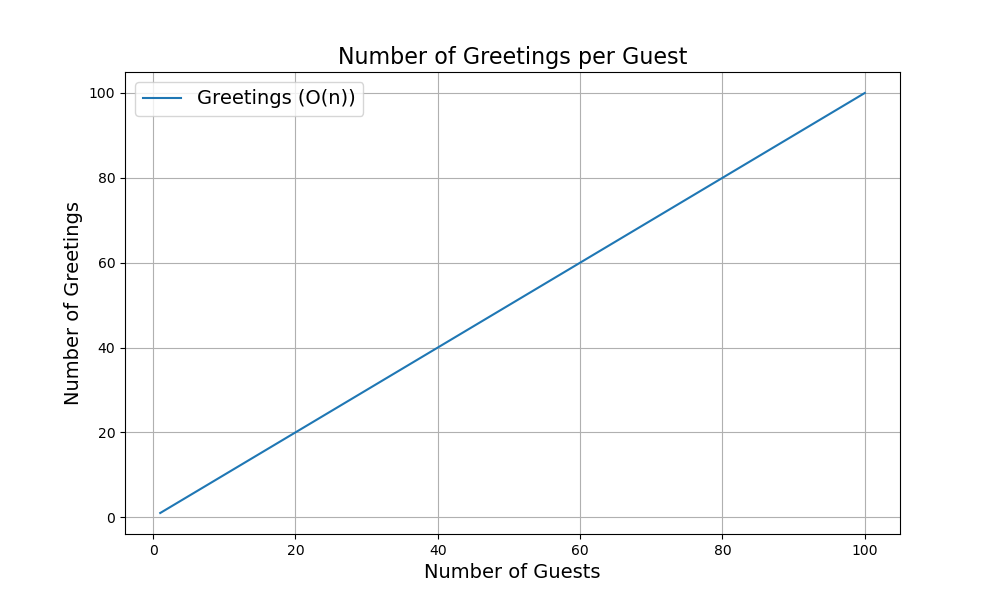
The first task is greeting each guest as they arrive at your house. Every additional guest arriving will have to be greeted. If one expressed the number of greetings
The number of greetings increases “linearly” with the number of guests. This is because you can draw a straight line representing the number of greetings (y-axis) as a function of the number of guests (x-axis).
Expand to view code
import matplotlib.pyplot as plt
import numpy as np

# Number of guests
n = np.arange(1, 101)

# Number of greetings
greetings = n

plt.figure(figsize=(10, 6))
plt.plot(n, greetings, label='Greetings (O(n))', color='tab:blue')
plt.xlabel('Number of Guests', fontsize=14)
plt.ylabel('Number of Greetings', fontsize=14)
plt.title('Number of Greetings per Guest', fontsize=16)
plt.legend(fontsize=14)
plt.grid(True)
plt.show()
From this point on, this article will require slightly more advanced calculus including basic integer summation, logarithms and exponentials.
Introducing Guests: Quadratic Complexity
While crafting the guest list, you realise that most of the guests do not know each other. How would you deal with this problem? One idea is to introduce the new guest to every guest already present.
- Guest 1: no introduction required, a greeting is enough
- Guest 2: introduce guest 2 to guest 1
- Guest 3: introduce guest 3 to guests 1 & 2
- Guest 4: introduce guest 4 to guests 1, 2 & 3
- Etc..
For four guests, the total number of introductions is
Expressing the number of introductions as a function of the number of guests
The sum of all integers from 1 to
Splitting the fraction:
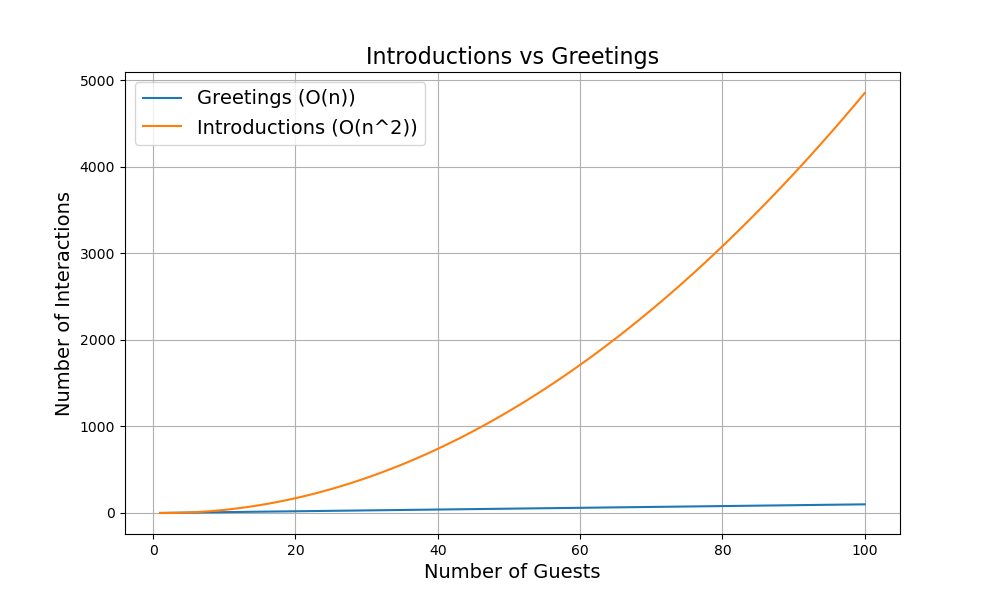
Plotting the number of introductions by guests we get the following curve, growing much faster than the number of greetings.
Expand to view code
import matplotlib.pyplot as plt
import numpy as np

# Number of guests
n = np.arange(1, 101)

# Number of greetings
greetings = n

# Number of introductions
introductions = (n - 1) * (n - 2) / 2

plt.figure(figsize=(10, 6))
plt.plot(n, greetings, label='Greetings (O(n))', color='tab:blue')
plt.plot(n, introductions, label='Introductions (O(n^2))', color='tab:orange')
plt.xlabel('Number of Guests', fontsize=14)
plt.ylabel('Number of Interactions', fontsize=14)
plt.title('Introductions vs Greetings', fontsize=16)
plt.legend(fontsize=14)
plt.grid(True)
plt.show()
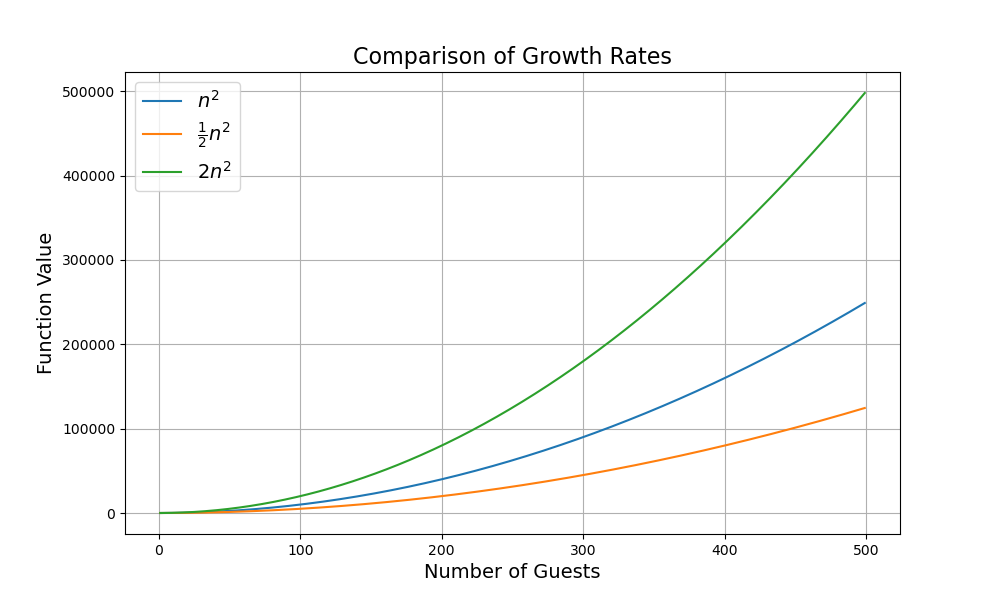
When
To visualise this growth rate, plotting the functions
Expand to view code
import matplotlib.pyplot as plt
import numpy as np

# Number of guests
n = np.arange(1, 500)

# Functions
n_squared = n**2
half_n_squared = 0.5 * n**2
two_n_squared = 2 * n**2

plt.figure(figsize=(10, 6))
plt.plot(n, n_squared, label='$n^2$', color='tab:blue')
plt.plot(n, half_n_squared, label='$\\frac{1}{2} n^2$', color='tab:orange')
plt.plot(n, two_n_squared, label='$2 n^2$', color='tab:green')
plt.xlabel('Number of Guests', fontsize=14)
plt.ylabel('Function Value', fontsize=14)
plt.title('Comparison of Growth Rates', fontsize=16)
plt.legend(fontsize=14)
plt.grid(True)
plt.show()
Playing “Who’s Who?”: Logarithmic Complexity
Going back to your party, you have finally made it past the introductions. Now that all guests know each other, they are ready to play a round of “Who’s Who?”.
The purpose of this game is to guess the person selected by a player within a group by asking as few yes/no questions as possible. The goal of each question is to “eliminate” a part of the group with each question until you arrive at a single guest. The best questions eliminate around half of the group. This is why the questions: “is the selected person a man?” and “do they wear glasses?” are crowd favourites.
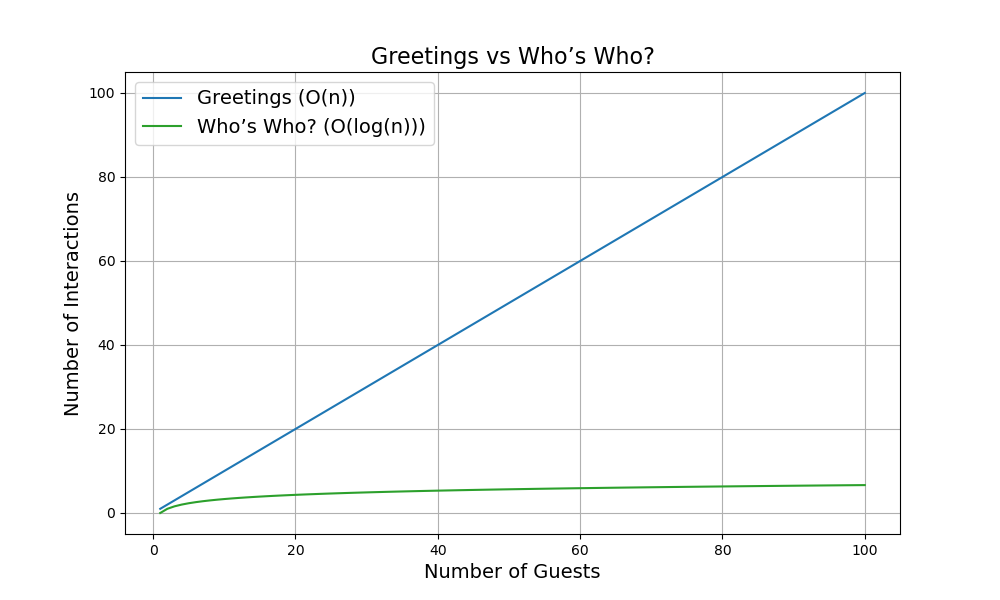
In your analysis, you want to understand how the number of questions you will need to win as the number of guests grows to infinity. You can assume that each question you ask divides the group by 2.
Try to figure this out before reading on.
We are trying to figure out how many times we need to divide the number of guests
Expand to view code
import matplotlib.pyplot as plt
import numpy as np

# Number of guests
n = np.arange(1, 101)

# Number of greetings
greetings = n

# Number of questions in "Who’s Who?"
questions = np.log2(n)

plt.figure(figsize=(10, 6))
plt.plot(n, greetings, label='Greetings (O(n))', color='tab:blue')
plt.plot(n, questions, label='Who’s Who? (O(log(n)))', color='tab:green')
plt.xlabel('Number of Guests', fontsize=14)
plt.ylabel('Number of Interactions', fontsize=14)
plt.title('Greetings vs Who’s Who?', fontsize=16)
plt.legend(fontsize=14)
plt.grid(True)
plt.show()
Using a numerical example, moving from 100 to 150 guests will increase the number of greetings by 50, the number of introductions by 1225 and the number of questions by 1 (from 7 to 8).
Quick tip if you host a large party, you may prefer to play “Who’s Who?” to introducing each guest to the guests already present.
Taking Photos: Exponential Complexity
As a last activity, to keep good memories of the party, you decide to take a picture of every possible combination of the guests present.
- 0 guest:
- 1 guest:
- 2 guests:
- 3 guests:
- Etc…
What would be the number of photos required for
One could recognise the sequence
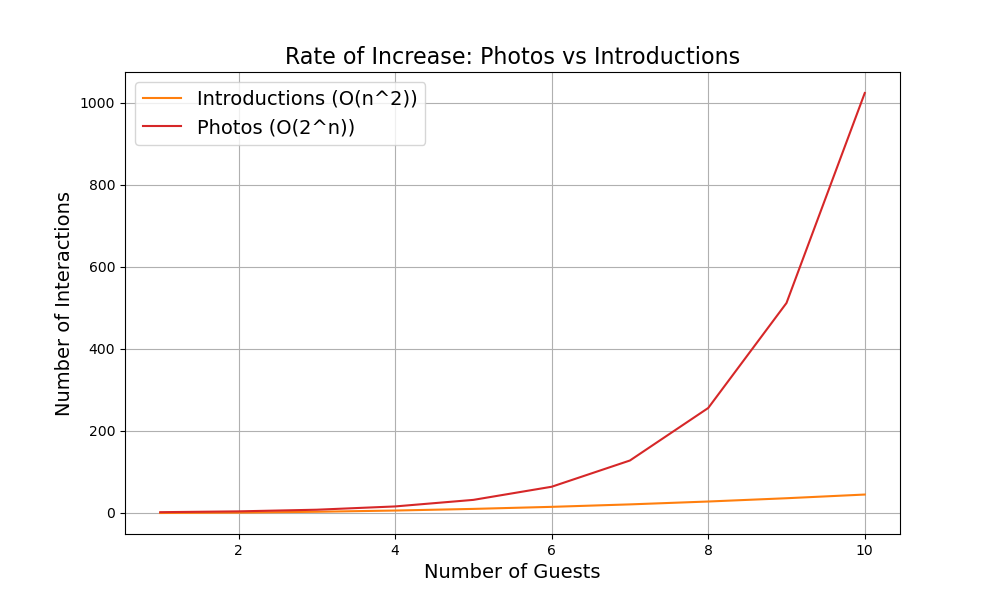
Plotting this next to the number of guest introductions we quickly understand that this is a terrible idea only used to illustrate a specific time complexity. When looking at the chart below, pay attention to the x-axis to see how quickly the number of photos increases, even when compared with the number of introductions required.
Expand to view code
import matplotlib.pyplot as plt
import numpy as np

# Number of guests
n = np.arange(1, 11)

# Number of introductions
introductions = (n * (n - 1)) / 2

# Number of photos
photos = 2**n

plt.figure(figsize=(10, 6))
plt.plot(n, introductions, label='Introductions (O(n^2))', color='tab:orange')
plt.plot(n, photos, label='Photos (O(2^n))', color='tab:red')
plt.xlabel('Number of Guests', fontsize=14)
plt.ylabel('Number of Interactions', fontsize=14)
plt.title('Rate of Increase: Photos vs Introductions', fontsize=16)
plt.legend(fontsize=14)
plt.grid(True)
plt.show()
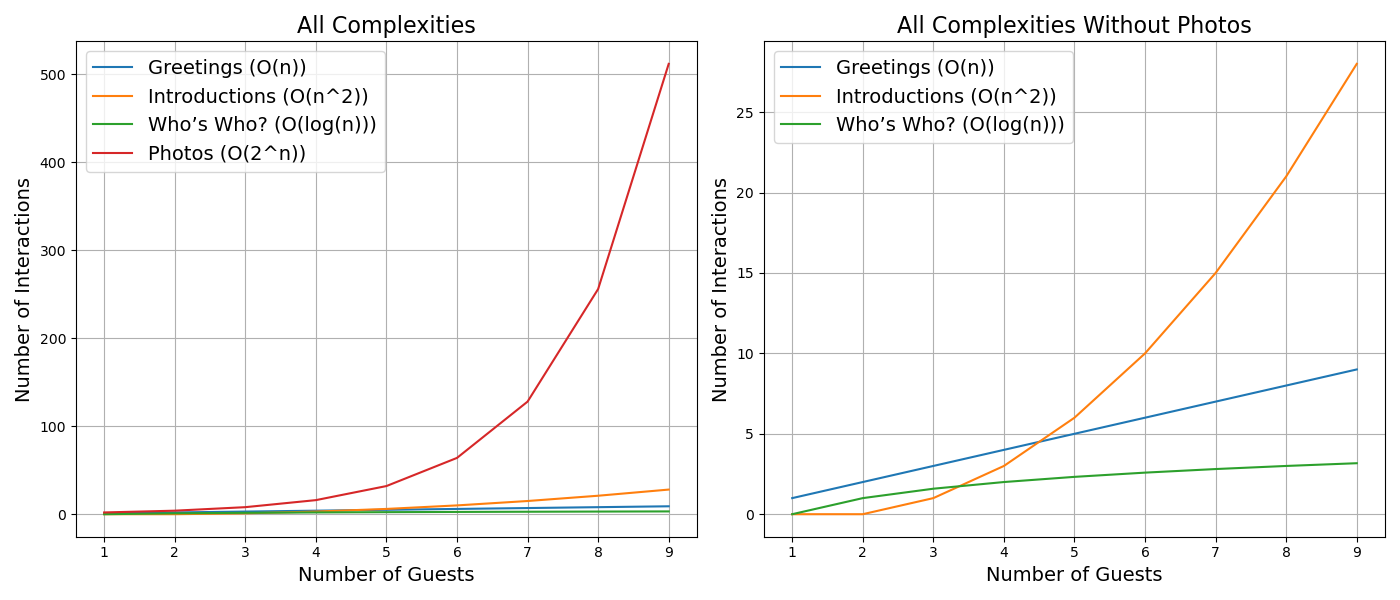
Plotting all complexities on a single chart, all of these tasks have a different rate of growth with regards to the number of guests. Some, like “Who’s who?” grow very slowly; others like the introductions or photos of combinations grow much quicker.
Expand to view code
import matplotlib.pyplot as plt
import numpy as np

# Number of guests
n = np.arange(1, 10)

# Number of greetings
greetings = n

# Number of introductions
introductions = (n - 1) * (n - 2) / 2

# Number of questions in "Who’s Who?"
questions = np.log2(n)

# Number of photos
photos = 2**n

fig, (ax1, ax2) = plt.subplots(1, 2, figsize=(14, 6))

ax1.plot(n, greetings, label='Greetings (O(n))', color='tab:blue')
ax1.plot(n, introductions, label='Introductions (O(n^2))', color='tab:orange')
ax1.plot(n, questions, label='Who’s Who? (O(log(n)))', color='tab:green')
ax1.plot(n, photos, label='Photos (O(2^n))', color='tab:red')
ax1.set_xlabel('Number of Guests', fontsize=14)
ax1.set_ylabel('Number of Interactions', fontsize=14)
ax1.set_title('All Complexities', fontsize=16)
ax1.legend(fontsize=14)
ax1.grid(True)

ax2.plot(n, greetings, label='Greetings (O(n))', color='tab:blue')
ax2.plot(n, introductions, label='Introductions (O(n^2))', color='tab:orange')
ax2.plot(n, questions, label='Who’s Who? (O(log(n)))', color='tab:green')
ax2.set_xlabel('Number of Guests', fontsize=14)
ax2.set_ylabel('Number of Interactions', fontsize=14)
ax2.set_title('All Complexities Without Photos', fontsize=16)
ax2.legend(fontsize=14)
ax2.grid(True)

plt.tight_layout()
plt.show()
Final Thoughts
This example illustrates certain tasks grow much faster than others as the input size grows towards infinity. Here, the input was the number of guests. For a sorting algorithm, this would be the size of the array to be sorted.
When developing algorithms or organising a party, ask yourself: how does this task’s complexity grow as input tends towards infinity? In other words, how does it scale?